
Maps and Data
2012–2014
Data Map
· Accused priests: Who they are, where they’ve served, what’s alleged
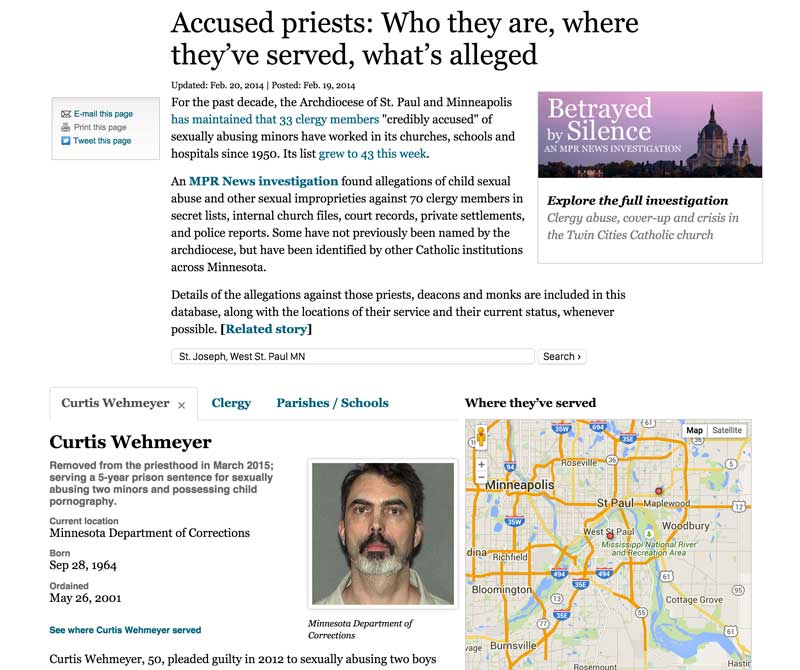
A large team of journalists and editors worked for over a year investigating the pattern of sexual abuse by priests and the Catholic Church’s systemic cover-up of the abuse. Journalist Meg Martin compiled a detailed list of information about priests accused and convicted of abuse. We published this information online and organized into a searchable database that showed our audience when and where the priests served.
I was a small part of this team and built a simple interface for this database using portions of twitter bootstrap and d3.js. The journalists and producers could simply export new CSV files anytime data was added or updated.
This project, specifically the database of priests, won the University of Florida’s award in Investigative Data Journalism for a Small/Medium organization from the Online News Association.
Comparison Maps
· The Marriage and Voter ID votes by precinct
· Same-sex marriage votes compared
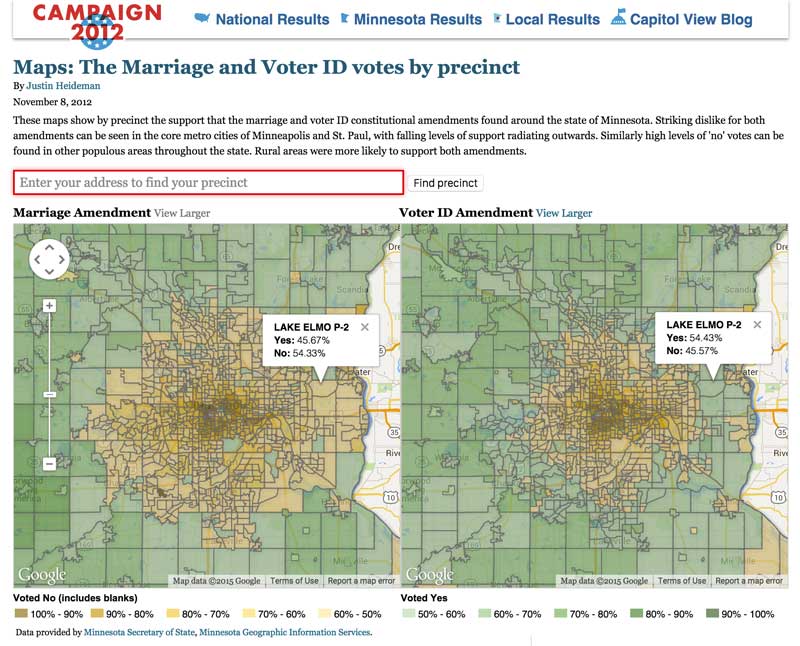
The 2012 election was a tumultuous time in Minnesota politics and these two maps illustrated just how quickly the dynamics changed.
Timeline Map
· Storm Ready: Is the Twin Cities area prepared for a major tornado?
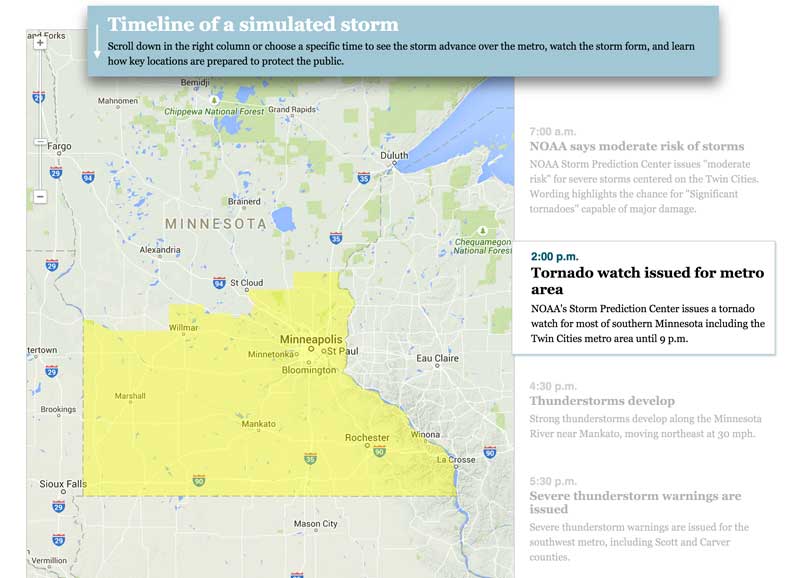
In 2011, a small tornado tore through North Minneapolis, killing one person and destroying many homes. In 2012, MPR News created a radio series that attempted to address how prepared the Twin Cities are for a large tornado. This online component illustrates the path a tornado could take and how the timeline could play out.